monitoring
#Monitoring
The architecture diagram of a notification system:

SNS topic: my-test-topic
Host metrics:
setup Cloud Watch Agent for additional metrics from EC2 https://www.wellarchitectedlabs.com/cost/200_labs/200_aws_resource_optimization/4_memory_plugin/
Alerts
- prod-EC2-CPU-above-90%
- awsrds-prod-vpc-Low-Free-Storage-Space - Check when database space lower than 5Gb
- awsec2-i-06dd0928d238e33ca-High-Status-Check-Failed-Any- - Monitor failed Production instance
- prod-RDS-CPU-above-85%
- prod-EC2-disk-above-85%
- prod-EC2-memory-above-85%
- prod-EC2-network-1Gb-in - Alert if instance receive requests with bandwidth > 1Gb per second
Services alerts
Alerts:
Containers down for more than 3 min for each main service (see file alert.rules)
Monitoring dashboard:
New monitoring dashboard Services Info
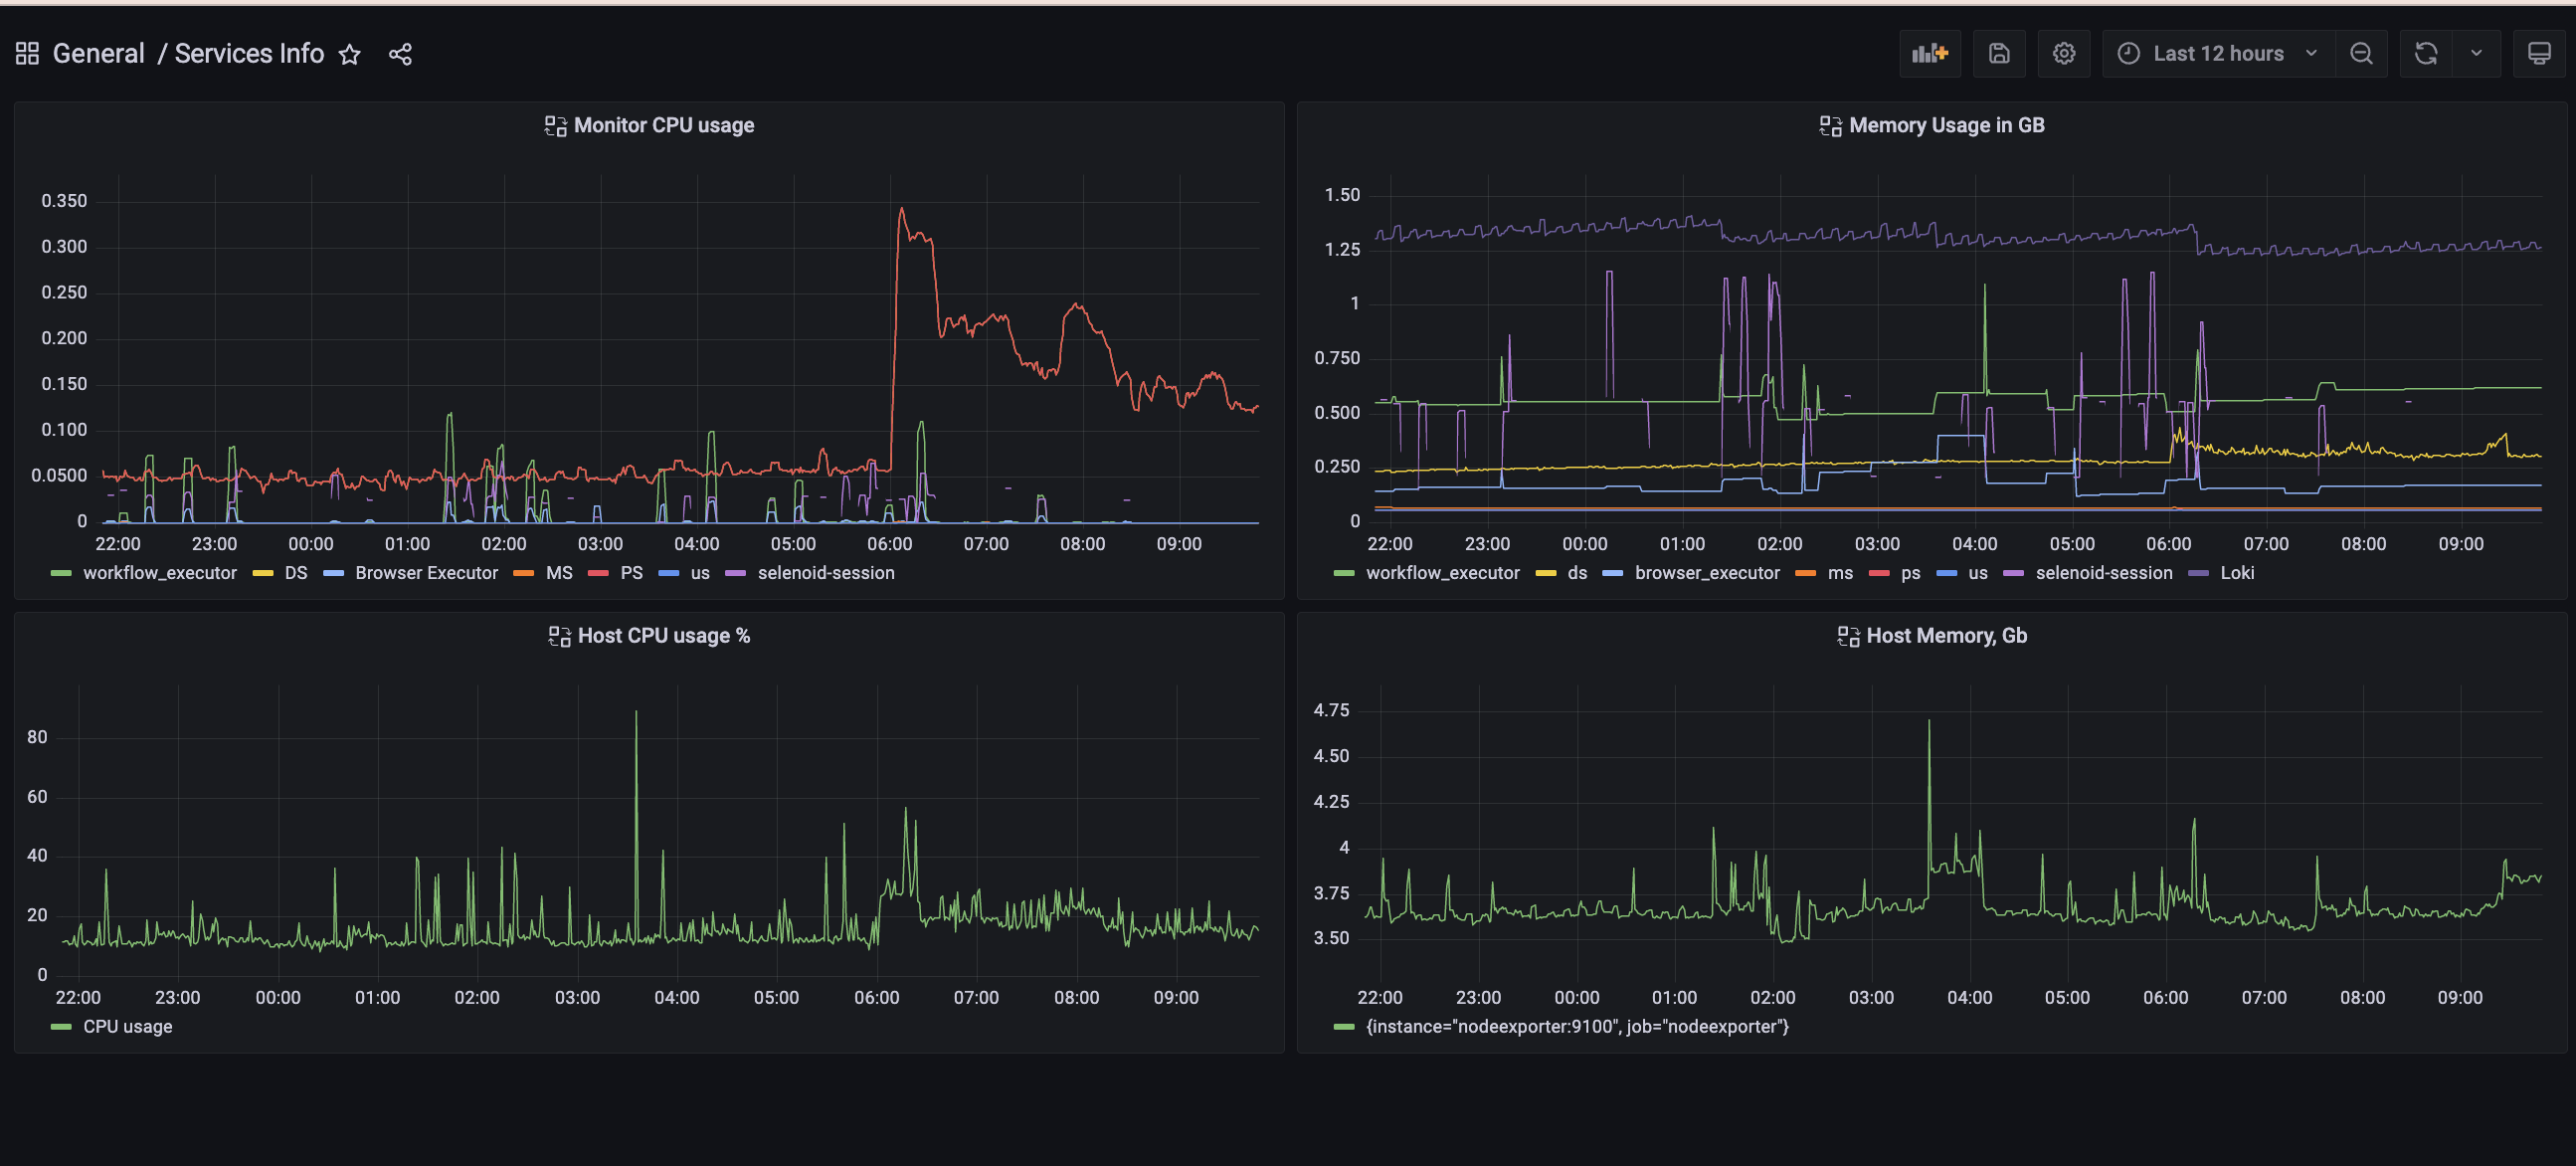 On this dashboard you can observe, how much memory,CPU each service use.
Query for getting CPU usage per container is:
sum(rate(container_cpu_usage_seconds_total{name="workflow_executor"}[5m]))
We need to use sum, because prometheus+cAdvisor(container advisor) capture CPU usage for each CPU core that we have.
Query for getting memory usage in GB is:
container_memory_usage_bytes{name="workflow_executor"} / 1000000000
Next steps:
- Understand what we need to improve and what we need to capture.
- Add serverless metrics to prometheus or point Grafana to CloudWatch